Florida PIRG Education Fund
The ability to see how government uses the public purse is fundamental to democracy. Transparency in government spending checks corruption, bolsters public confidence, improves responsiveness, and promotes greater effectiveness and fiscal responsibility.
Cities across the country have been moving toward making their checkbooks transparent by creating transparency portals and posting recipient-specific spending data online. Currently, 17 of America’s 30 most populous cities provide online databases of government expenditures with “checkbook-level” detail.[*] Online checkbooks in most cities are searchable, making it easier for residents to follow the money and monitor government spending.
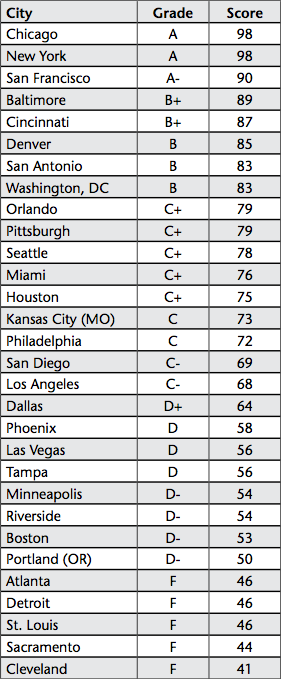
Following our earlier studies of government spending at the state level, this report evaluates the progress of America’s 30 largest cities toward “Transparency 2.0” – a standard of comprehensive, one-stop, one-click budget accountability and accessibility. Twelve scoring criteria were used to measure the breadth of information each city provides on-line and the information’s searchability. Since the deployment of city resources is intimately linked to providing everyday quality-of-life services for constituents, these criteria also include how well cities enable residents to make and track service requests online. Based on these findings, we then assigned each city a number grade from zero to 100 and a corresponding letter grade from “A” to “F.” (See Table ES-1 for the list of cities and grades. See Appendix D for the methodology.)
Out of America’s largest cities, three stand out as leaders in online transparency – earning “A” grades based on our criteria.
Over the next year, America’s other large cities should improve their transparency websites, providing their residents with greater access to information about city spending decisions. Some cities may want to take advantage of New York City’s open code to adapt functionality without paying outside programmers.
America’s largest cities fall into five categories, based on the breadth, depth and searchability of government spending information:
- Leading cities (“A” range): Three cities lead the pack in delivering easy-to-access, encompassing information on government spending. Two of these cities – Chicago and New York – are models for how cities should make spending data accessible to the public. The other city – San Francisco – provides residents with a broad range of government spending data, yet needs to centralize all spending information and deepen its commitment to providing information on tax expenditures. These three cities allow residents to monitor their city’s responses to all service requests submitted online and to access service request data through a download feature or application programming interface (API).
- Advancing cities (“B” range): Five cities – Baltimore, Cincinnati, Denver, San Antonio and Washington, DC – have made government spending information available online, but the data are either slightly more limited or more difficult to access than the spending data in Leading cities.
- Emerging cities (“C” range): Nine cities have made efforts to open the books on government spending, but have checkbook tools that lack the ease-of-use of Advancing and Leading cities and provide less information on spending through the tax code.
- Lagging cities (“D” range): Eight cities provide residents with basic spending documents, such as the budget and Comprehensive Annual Financial Report (CAFR) – a document that reports on the city’s actual spending and financial solvency. All lagging cities also provide residents with service request portals. However, these cities provide little other spending information.
- Failing cities (“F” range): Five cities have made minimal progress in meeting Transparency 2.0 standards. These cities provide very little information beyond the data on the budget and CAFR. No Failing city provides residents with an on-line checkbook of the city’s expenses – keeping citizens in the dark on which companies and non-profits receive taxpayer funds.
Table ES-1: How America’s 30 Largest Cities Rate in Providing Online Access to Government Spending and Service Request Data
Some cities have gone above and beyond basic Transparency 2.0 standards. They have developed new tools and posted new sets of information on government expenditures, giving residents the unprecedented ability to monitor and influence how their government allocates resources.
- Tax revenue data: A few cities have taken steps to disclose details on how much the city government collects in taxes from various sources. Tampa posts the amount of business tax paid by every company in the city and Portland (OR) posts property tax amounts for every parcel along with the property’s worth.
- Conflict of interest prevention: Pittsburgh empowers watchdog groups and residents to prevent conflicts of interest by requiring mayors and city councilors to file reports – which are published online – detailing their connections to all businesses and corporate entities, properties, creditors and debtors.
- Performance metrics: Some cities, such as Boston, Minneapolis and Seattle, provide detailed performance evaluations of government services and departments to enable citizens to assess how citizen needs are being met and how city leaders are investing taxpayer dollars.
All cities, including Leading cities, have many opportunities to improve their online spending transparency.
- Thirteen of the cities have yet to provide online databases of government expenditures with “checkbook-level” detail. As checkbook-level spending information is a basic standard of Transparency 2.0, these cities should prioritize posting their checkbooks online.
- Out of the 17 cities that provide checkbook databases, six have not made their checkbooks searchable and eight have not made their checkbooks downloadable.
- Only five cities provide website visitors with copies of contracts between vendors and the city.
- Only five cities disclose the tax subsidies awarded to individual companies and recipients.
- Only 11 cities allow residents to view service requests submitted by other residents and the city’s responses to those requests.
- Only 10 cities have made service request data downloadable or available through an application programming interface.
- Only 13 cities maintain a centralized transparency portal that contains government spending tools and documents.
In the next year, city governments should launch and improve transparency websites that provide detailed information on government expenditures. With continued progress toward online transparency, citizens will be able to access information on every dollar of their city’s spending and how service requests are handled – so they can actively and constructively engage in public debates about how resources are allocated.
[*] The online spending transparency for the most populous city in each of America’s 30 most populous metropolitan areas was assessed. For an explanation of how these cities were derived, see Appendix D.